Tax Impact Information
Debt Repayment Breakdown
The November 4th bond proposes a public funded capital investment to replace the current Lynden High School. The proposed project addresses enrollment growth, aging infrastructure, and the need for purpose-built spaces that support learning for skilled jobs in the trades and post-secondary education.
- Estimated Total Cost of Project: $160,006,278
- Estimated State Assistance Funds: $31,000,000
- Total Bond Request Amount: $129,006,278
If passed by voters, bonds are sold on open market as funds are needed to complete phases of the project. This is typically done across three cycles with each repayment term limited to a maximum of 22 years. Terms are not set, nor interest rates known, until bonds are sold. Estimates are set using current municipal bond rates plus 1%. Estimate being used for bonds sold in 2026 is 5.81%.
- Estimated Total Cost of Debt Repayment (fees & interest): $253,059,000
The table below is intended to help property owners understand the long-term tax impacts. An assumption of an annual 4% increase in total property value is used to complete the estimates. It is important to understand that the Lynden School District will only collect the amount approved by voters which is the proposed amount of $129,006,278.
The assessor’s office adjusts the rate collected from property owners annually to ensure this is the case. In other words, the district does not collect more money if property values increase beyond the 4% assumption used in calculating the estimates.
| Year | Total Assessed Value of All Taxable Property in the District (assumes 4% annual growth) | Annual Tax Collection by District for 2025 Bond | Estimated Tax Rate for 2025 Bond | ‘Example House’ Value (assumes 4% annual growth) | ‘Example House’ estimated annual tax for 2025 bond |
|---|---|---|---|---|---|
| 2025 | $5,409,633,038 | No Collection | No Collection | $600,000 | No Collection |
| 2026 | $5,626,018,360 | No Collection | No Collection | $624,00 | No Collection |
| 2027 | $5,851,059,094 | $6,603,000 | $1.13 per $1,000 | $648,960 | $733 |
| 2028 | $6,085,101,458 | $6,866,000 | $1.13 per $1,000 | $674,918 | $763 |
| 2029 | $6,328,505,516 | $7,162,000 | $1.13 per $1,000 | $701,915 | $793 |
| 2030 | $6,581,645,737 | $7,447,000 | $1.13 per $1,000 | $729,992 | $825 |
| 2031 | $6,844,911,566 | $7,747,000 | $1.13 per $1,000 | $759,191 | $858 |
| 2032 | $7,118,708,029 | $8,058,000 | $1.13 per $1,000 | $789,559 | $892 |
| 2033 | $7,403,456,350 | $8,379,000 | $1.13 per $1,000 | $821,141 | $928 |
| 2034 | $7,699,594,604 | $8,714,000 | $1.13 per $1,000 | $853,987 | $965 |
| 2035 | $8,007,578,388 | $9,064,000 | $1.13 per $1,000 | $888,147 | $1,001 |
| 2036 | $8,327,881,524 | $9,426,000 | $1.13 per $1,000 | $923,672 | $1,044 |
| 2037 | $8,660,996,784 | $9,801,000 | $1.13 per $1,000 | $960,619 | $1,086 |
| 2038 | $9,007,436,656 | $10,194,000 | $1.13 per $1,000 | $999,044 | $1,129 |
| 2039 | $9,367,734,122 | $10,602,000 | $1.13 per $1,000 | $1,039,006 | $1,174 |
| 2040 | $9,742,443,487 | $11,027,000 | $1.13 per $1,000 | $1,080,566 | $1,221 |
| 2041 | $10,132,141,226 | $11,465,000 | $1.13 per $1,000 | $1,123,789 | $1,270 |
| 2042 | $10,537,426,875 | $11,923,000 | $1.13 per $1,000 | $1,168,740 | $1,321 |
| 2043 | $10,958,923,951 | $12,404,000 | $1.13 per $1,000 | $1,215,489 | $1,374 |
| 2044 | $11,397,280,909 | $12,898,000 | $1.13 per $1,000 | $1,264,109 | $1,428 |
| 2045 | $11,853,172,145 | $13,415,000 | $1.13 per $1,000 | $1,314,673 | $1,486 |
| 2046 | $12,327,299,031 | $13,951,000 | $1.13 per $1,000 | $1,367,261 | $1,545 |
| 2047 | $12,820,390,992 | $14,511,000 | $1.13 per $1,000 | $1,421,951 | $1,607 |
| 2048 | $13,333,206,632 | $15,092,000 | $1.13 per $1,000 | $1,478,829 | $1,671 |
| 2049 | $13,866,534,897 | $15,695,000 | $1.13 per $1,000 | $1,537,982 | $1,738 |
| 2050 | $14,421,196,293 | $10,600,000 | $0.74 per $1,000 | $1,599,501 | $1,184 |
Tax Exemptions
If you are a senior citizen or a person with disabilities with your residence in Washington State, you may qualify for a property tax reduction under the property tax exemption for senior citizens and people with disabilities program.
Learn More at the Assessor’s Office website.
Total Tax Comparison
The total assessed value of all taxable property within a school district drives the millage rate set by the County Assessor’s Office. Voters approve a set amount to be collected annually by the taxing district and millage rates are then adjusted annually. Property ‘rich’ districts generally have lower millage rates than property ‘poor’ districts resulting in a higher burden placed on property owners in property ‘poor’ districts.
The table below represents 2025 property values of county school districts, the millage rates, and total amount of money collected by each school district. Taxes collected include operational levies, capital levies, and capital bonds.
| District | 2025 Property Assessed Value | 2025 Millage Rate per $1,000 | 2025 Total Tax Collection |
|---|---|---|---|
| Bellingham | $29.5 Billion | $3.07 | $90.7 Million |
| Ferndale | $9.3 Billion | $2.21 | $20.7 Million |
| Blaine | $7.8 Billion | $1.35 | $10.5 Million |
| Lynden | $5.4 Billion | $2.51 | $13.6 Million |
| Mount Baker | $3.9 Billion | $1.86 | $7.2 Million |
| Meridian | $2.7 Billion | $3.24 | $8.6 Million |
| Nooksack Valley | $2.2 Billion | $3.36 | $7.3 Million |
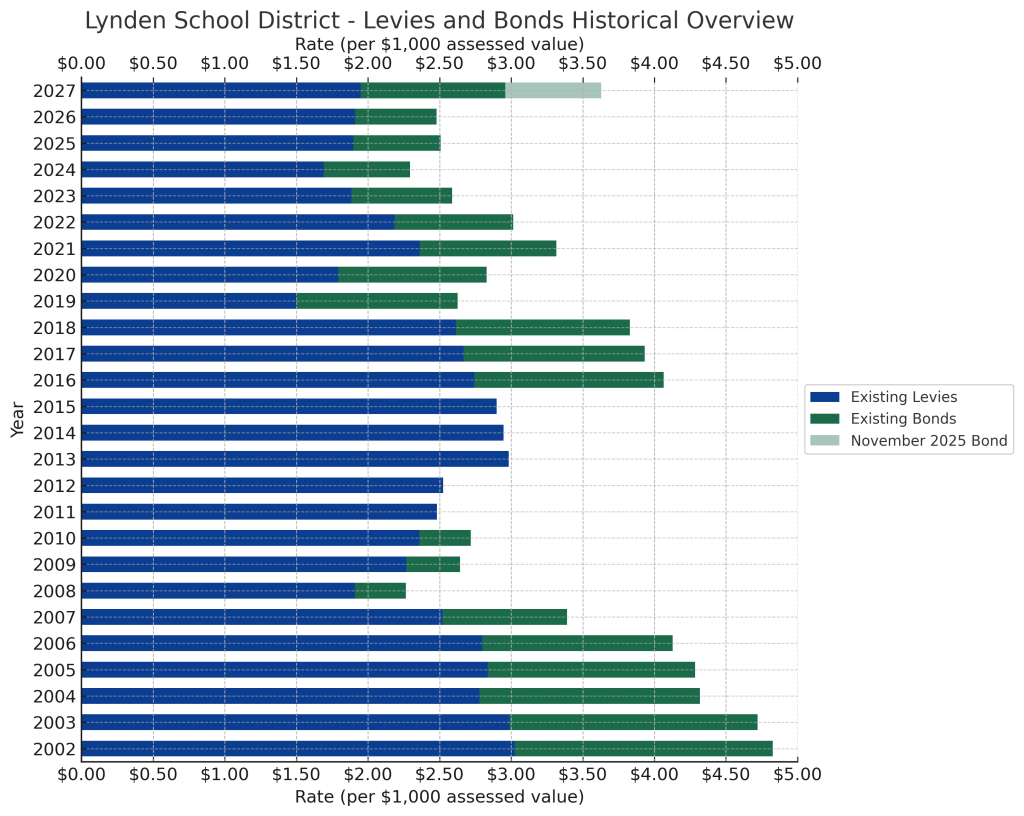
Historical District Tax Information
The school district is committed to responsible fiscal stewardship and seeks to maintain consistent tax rates.
The table below summarizes total tax rates of the previous 25 years.